There are 2 different reporting capabilities available on the Cydarm Platform that allow you to utilise incident data to reduce effort across stakeholder communication, uplift response post incident closure, comply with regulatory requirements, and inform future cybersecurity activities. The two capabilities are Situational and Operational reporting.
- Situational Reports - these are found on the Case View Page and represent incident information specific to the case or case group.
- Operational Reports - these are found under the Metrics tab, and are used to report on overall activity within Cydarm over a period of time, not just single cases or case groups.
Situational Reports
This guide will focus on Situational reports. For information pertaining to Operational Reports, please see the “Operational Reports” guide.
When to use Situational Reports
Situational reports allow the SOC team to share information on cases with the appropriate level of detail in situations like:
- Communicating updates to internal and external stakeholders
- Providing information on incidents/cases for regulatory compliance
- Exporting IoC data for cyber threat intelligence purposes
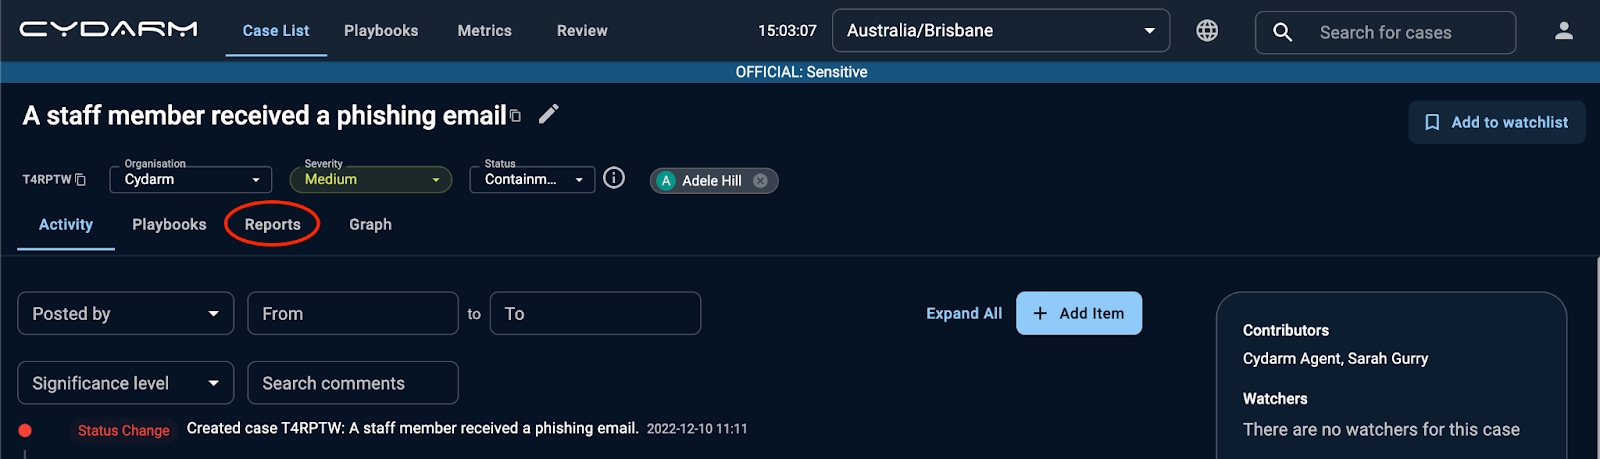
Where to generate Situational Reports
The situational reporting section can be found by clicking into a case, and then choosing the Reports tab in the Case Navigation area above the activity timeline.
How to generate Situational Reports
A guide to navigating the Situational Reports section
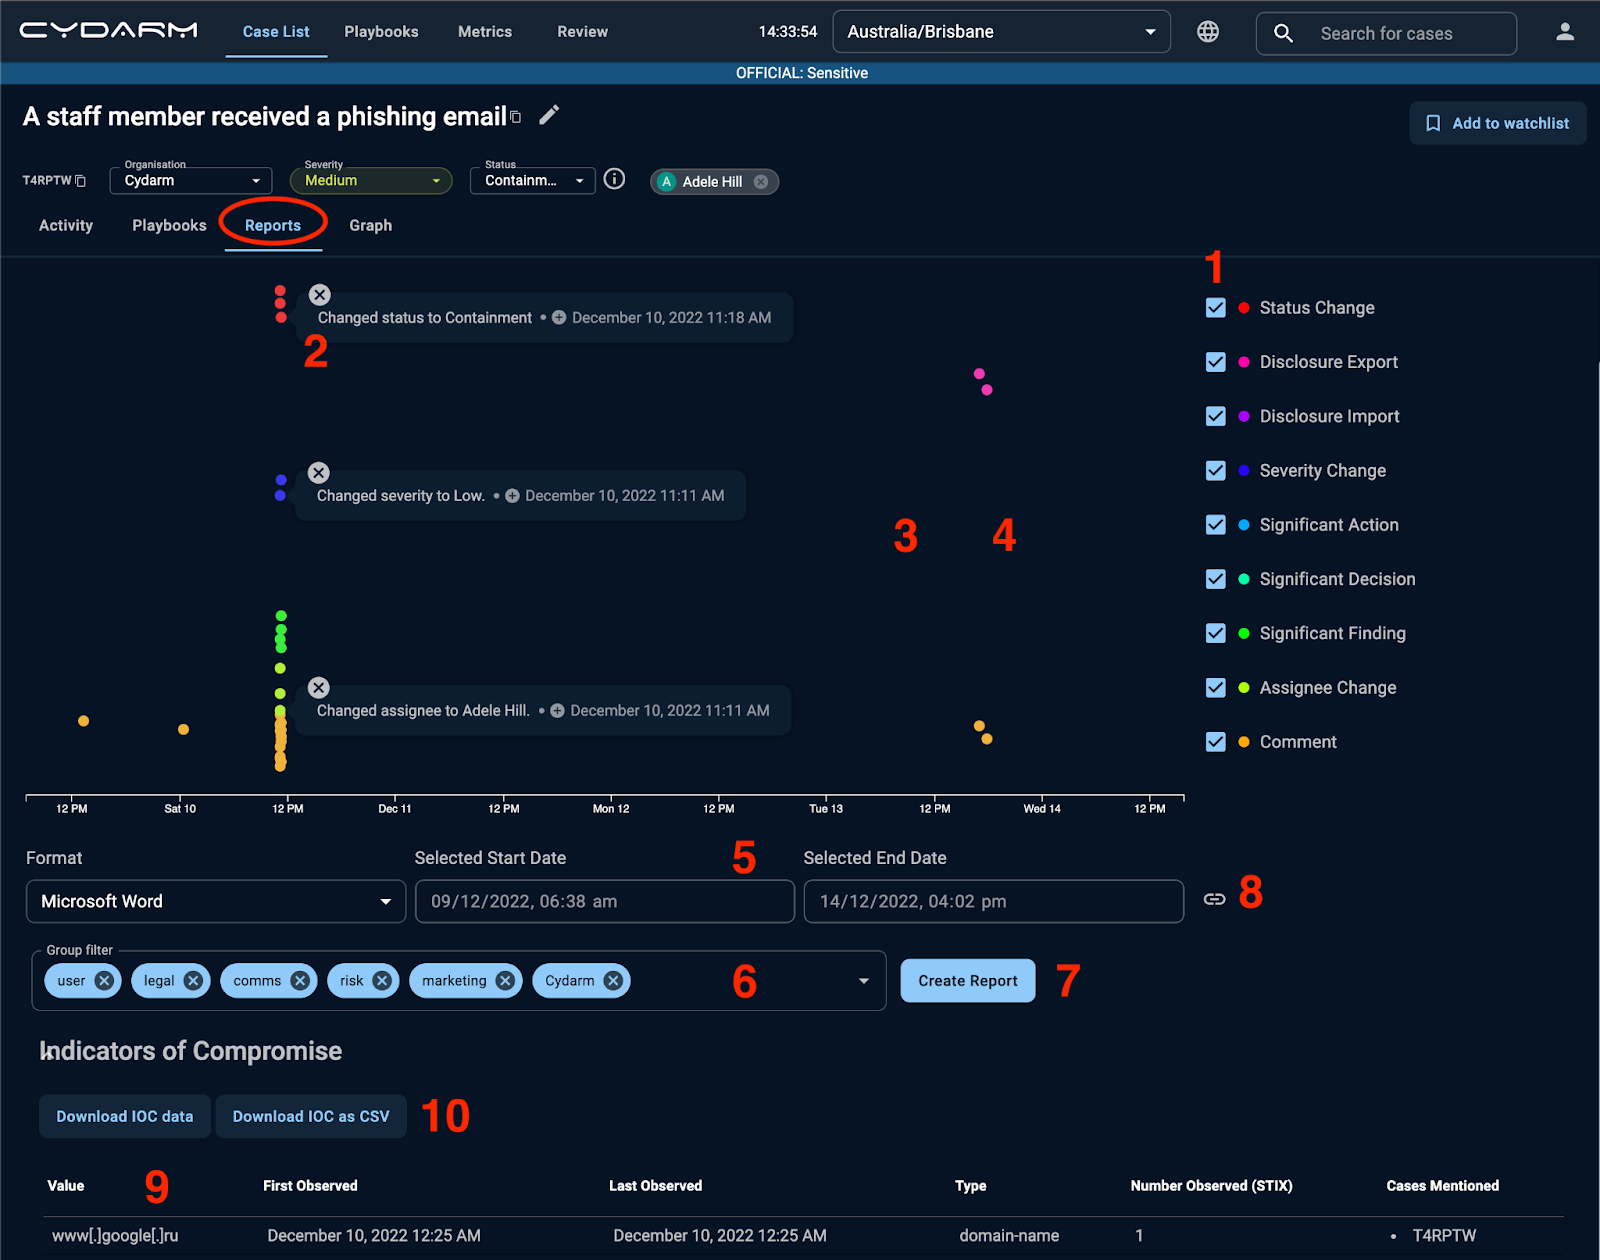
Key
- Check boxes to filter by comments
- Relevant dots/comments in the Activity thread
- Inside graph, Pan and Zoom using mouse to change the graph’s viewing perspective
- Inside graph, hold down on your mouse and drag left or right to position comment dots on graph
- Filter by date range
- Filter by Access Control
- Create Report button
- Link date range to graph
- List of IOCs front the Activity thread
- Download IOCs as a report
Report Filtering
On the Report page, you will find three ways you can filter your reports:
- By the comments you want to include in your reports
- By the date range of the report
- By the Access Control group(s) - the end recipient - who will view the report
Filter by data significance level
- To refine which data significance levels are shown on the timeline and included in your report you can select/deselect checkboxes on the right side of the Report page. You will note that these are the same colours bordering the level comments made within the Activity thread on the case view page.
- If you click on any of the graphed ‘coloured dots’, the corresponding data that was recorded in the Activity thread will appear alongside the dot. To dismiss this preview, click on the x.
- To view the activities from a closer ‘time of day’ perspective (or from a wider monthly or even yearly perspective), you can pan and zoom using your mouse anywhere inside the graph.
- To position the activities on the graph so they are in view, hold down on your mouse and drag left or right anywhere inside the graph
Filter by date range
- To filter by date via the date range input, use the Selected Start and End Dates under the timeline. As you change the date range, the changes will automatically update the handles on the chart – if the date range is out of view, the timeline automatically zooms/pans to fit the range. Note to activate these date-time boxes to make edits, you need to unlink the Link icon
- Alternatively, you can utilize the panning functionality as outlined in “Filter by data significance level”.
Filter by Access Control
- To edit the access controls applied to the report, click onto the access control filter field and select the control types that relate to the level of “need-to-know” for the report.
To generate a report
- To generate a “case report” or an “incident report” you click on Create Report. In doing so you will generate a report in Microsoft Word (DOCX) format for download. Click on the download to open the report and view it.
- You can use the Link Icon to link the report time range (Selected Start and End Dates) to the timeline.
Other actions
- When you have added an attack related Indicator of Compromise (IOC) to a report, (you do this on the Case View page) the list of IOCs will appear at the bottom of the Reports page and you will see them appear under the Event Timeline on the downloaded report.
- If the SOC team requires a report that specifically captures the IOC data, head to the bottom of the Report page and you will see two active buttons Download IOC data and Download IOC as CSV.
- ❗When you return to the Case View page (by clicking on the Activity tab) you will find that the system-generated post in the Activity thread will now include the case summary situational report.