There are 2 different reporting capabilities available on the Cydarm Platform that allow you to utilise incident data to reduce effort across stakeholder communication, uplift response post incident closure, comply with regulatory requirements, and inform future cybersecurity activities. The two capabilities are Situational and Operational reporting.
- Situational Reports - these are found on the Case View Page and represent incident information specific to the case or case group.
- Operational Reports - these are found under the Metrics tab, and are used to report on overall activity within Cydarm over a period of time, not just single cases or case groups.
Operational Reports
When to use Operational Reports
Operational Reports can be used in numerous ways: to track and meet SLA deadlines; to show response time and remediation of incidents; to measure the efficacy of SOC controls; and to make resource allocation decisions.
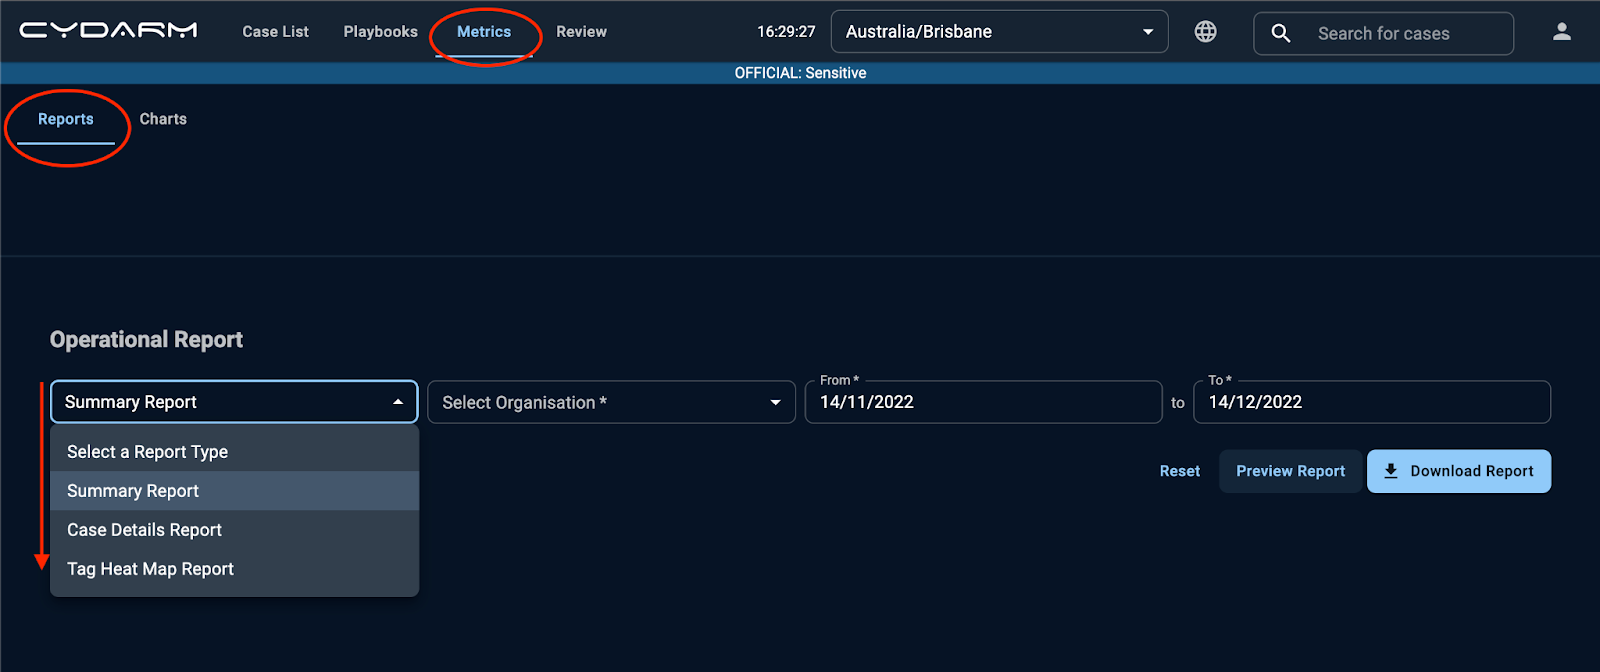
There are 3 different Operational reports:
- Summary Reports - a Word document report of activity over a time range
- Case Detail Reports - a CSV report with raw data, filtered by several criteria including tags, over a time range
- Tag Heat Map Report - a CSV that displays co-occurrence (tally) of tags on cases, over a time range, ie. how often do we see a particular mitre-attack tag on the same case as a particular case-type tag
Where to find Operational Reports
Operational Reports can be found under the Metrics tab in the main navigation menu next to the CYDARM logo.
How to generate Operational Reports
Summary Reports
- To generate a Summary Report click on the Report Type drop down menu and select Summary Report.
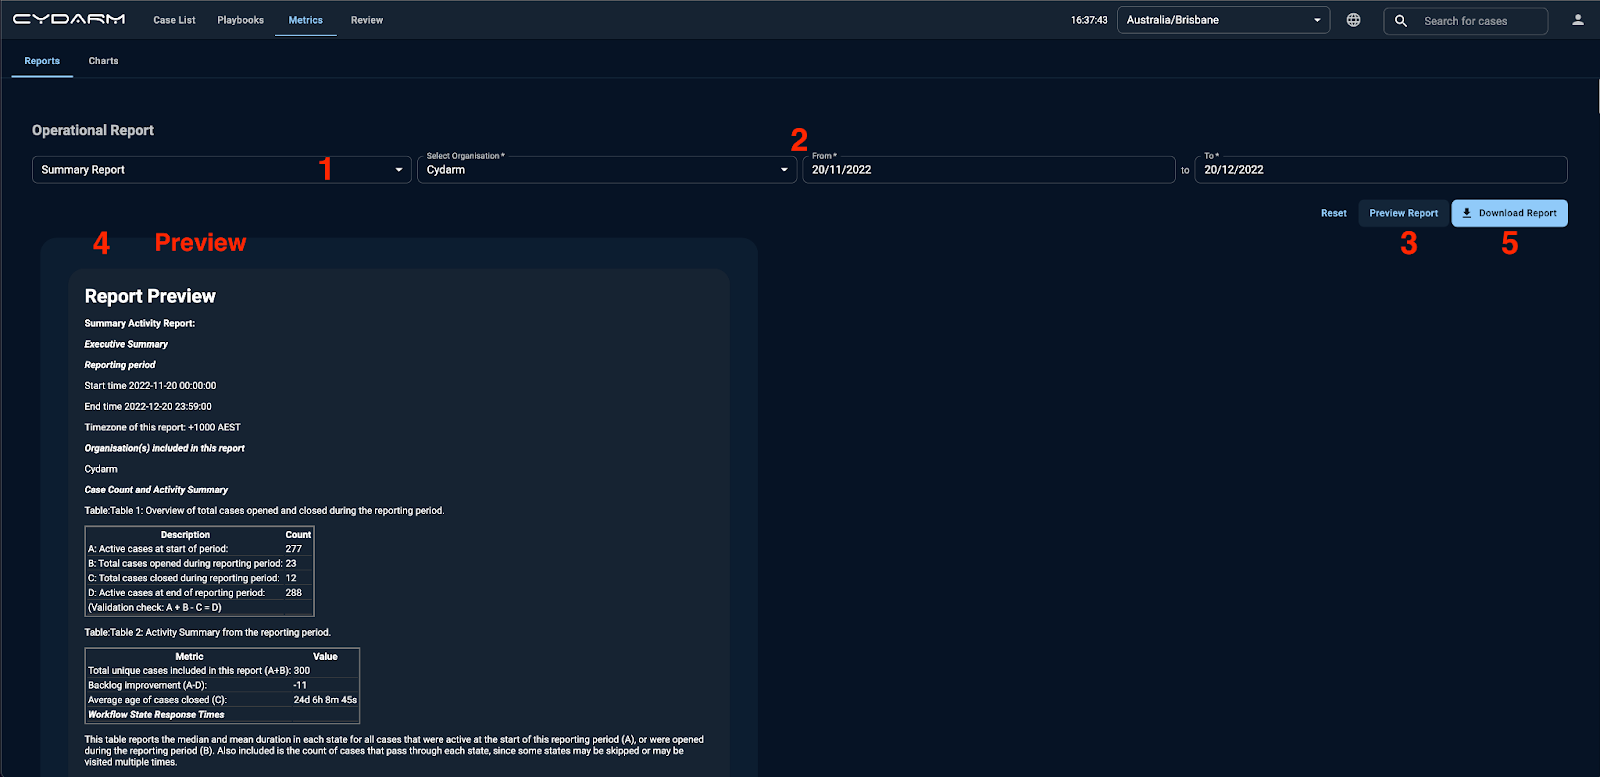
- Continue by selecting the Organisation and the Time Range for the report.
- You can preview the Summary Report by clicking on Preview Report.
- As you can see the report gives you a snapshot of operational statistics as well as a summary of all of the cases examined within the nominated time period.
- To download the report into a Word file in DocX format, click on the blue button Download Report which you can modify and tweak to suit your reporting needs.
Case Detail Reports
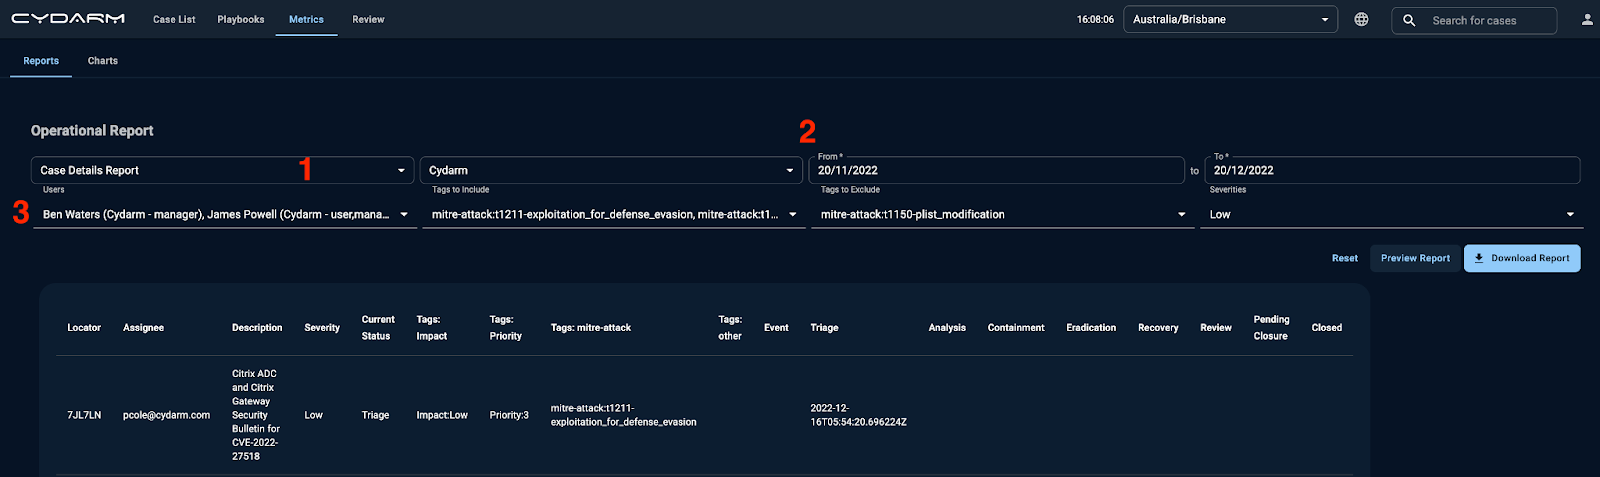
- To generate a Case Details Report click on the Report Type drop down menu and select Case Details Report
- Continue by selecting the Organisation and the Time Range for the report.
- You can filter the Case Details report on the bottom row by Users to include, Tags to Include, Tags to Exclude and Severities to include. These are optional filters so that if you decide not to use them, the report will default to include everything.
- You can preview the report as a table containing case metadata, by clicking the Preview Report button
- To download the report as a CSV file (so you can export case details for the given time period to other reporting systems/spreadsheets to do your own analysis and transformations of the data) click on the blue Download Report button.
Tag Heat Map Reports
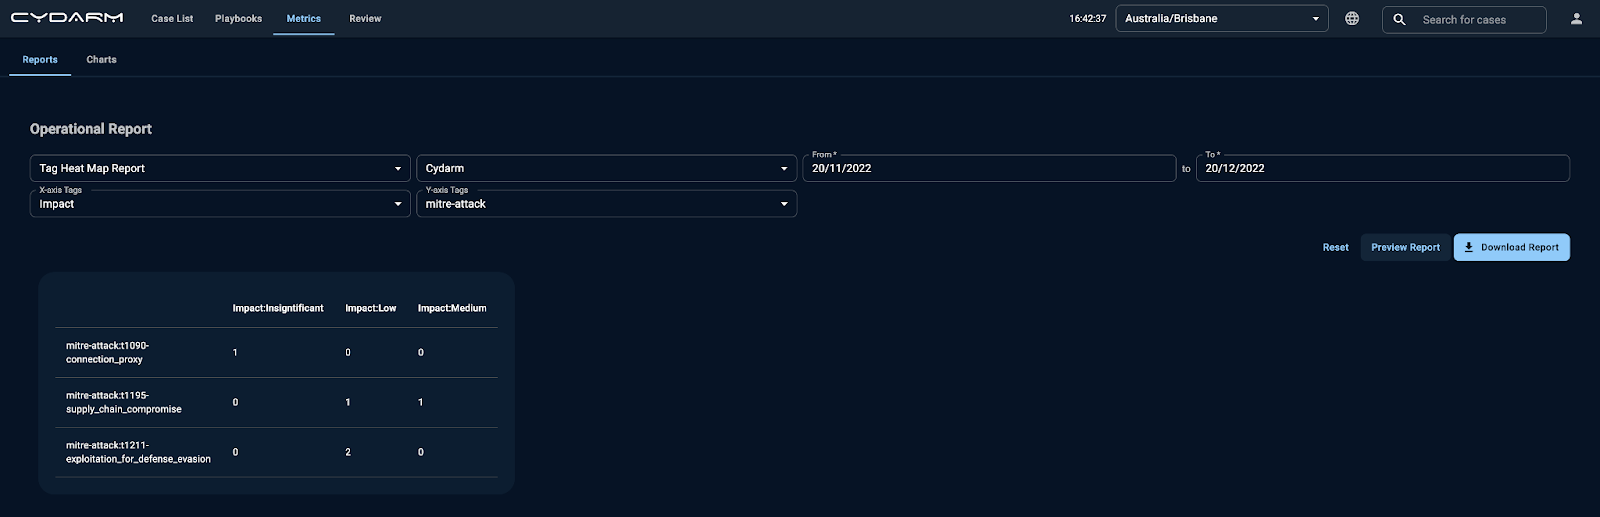
- To generate a Tag Heat Map Report click on the Report Type drop down menu and select Tag Heat Map Report.
- Continue by selecting the Organisation and the Date Ranges for the report.
- You can select the tags that you would like to see against the case in the X-axis and Y-axis Tags fields. This will allow you to visualise and take into account only the cases that contain tags in both of the tag families.
- To see a preview of the Tag Heat Map Report in tabular form, click on the Preview Report button
Downloading a Tag Heat Map Report
To download the report as a CSV file (so you can export case details for the given time period to other reporting systems/spreadsheets to do your own analysis and transformations of the data) click on the blue Download Report button.